Side by side
Plot dust and gas side-by-side.
Note
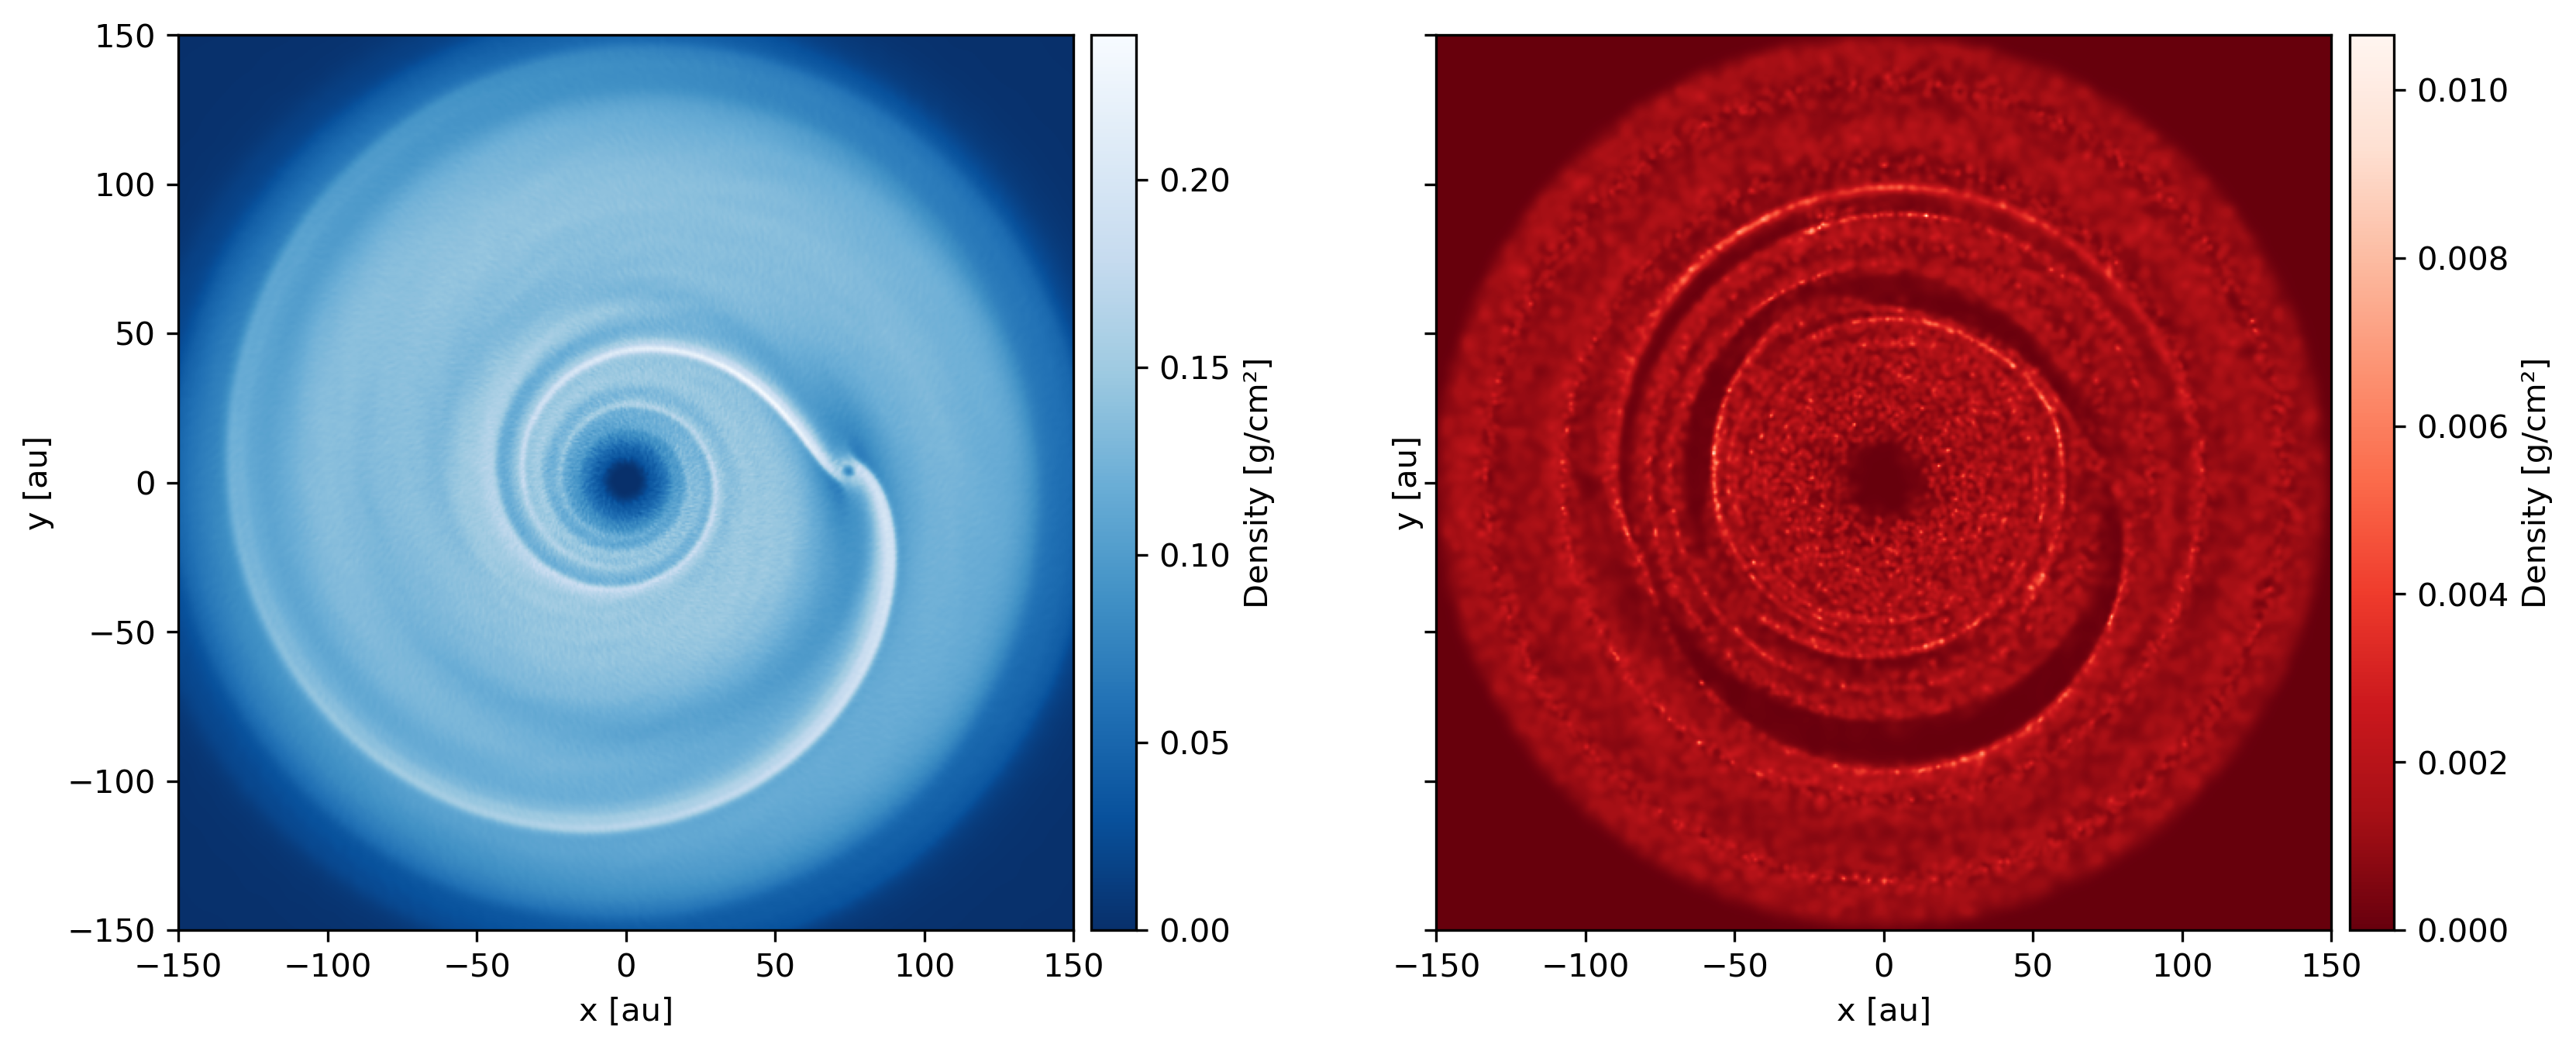
The data is from the example dataset of a Phantom simulation with a single dust species using the separate particles (or “2-fluid”) method with an embedded planet.
import matplotlib.pyplot as plt
import plonk

# Load the snapshot
snap = plonk.load_snap('disc_00030.h5')

# Set units for plot
snap.set_units(position='au', density='g/cm^3', projection='cm')

# Specify dust and gas subsnaps
gas = snap.family('gas')
dust = snap.family('dust', squeeze=True)
extent = (-150, 150, -150, 150) * plonk.units('au')

# Make plot
fig, axs = plt.subplots(ncols=2, sharey=True, figsize=(13, 5))
gas.image(quantity='density', extent=extent, cmap='Blues_r', ax=axs[0])
dust.image(quantity='density', extent=extent, cmap='Reds_r', ax=axs[1])