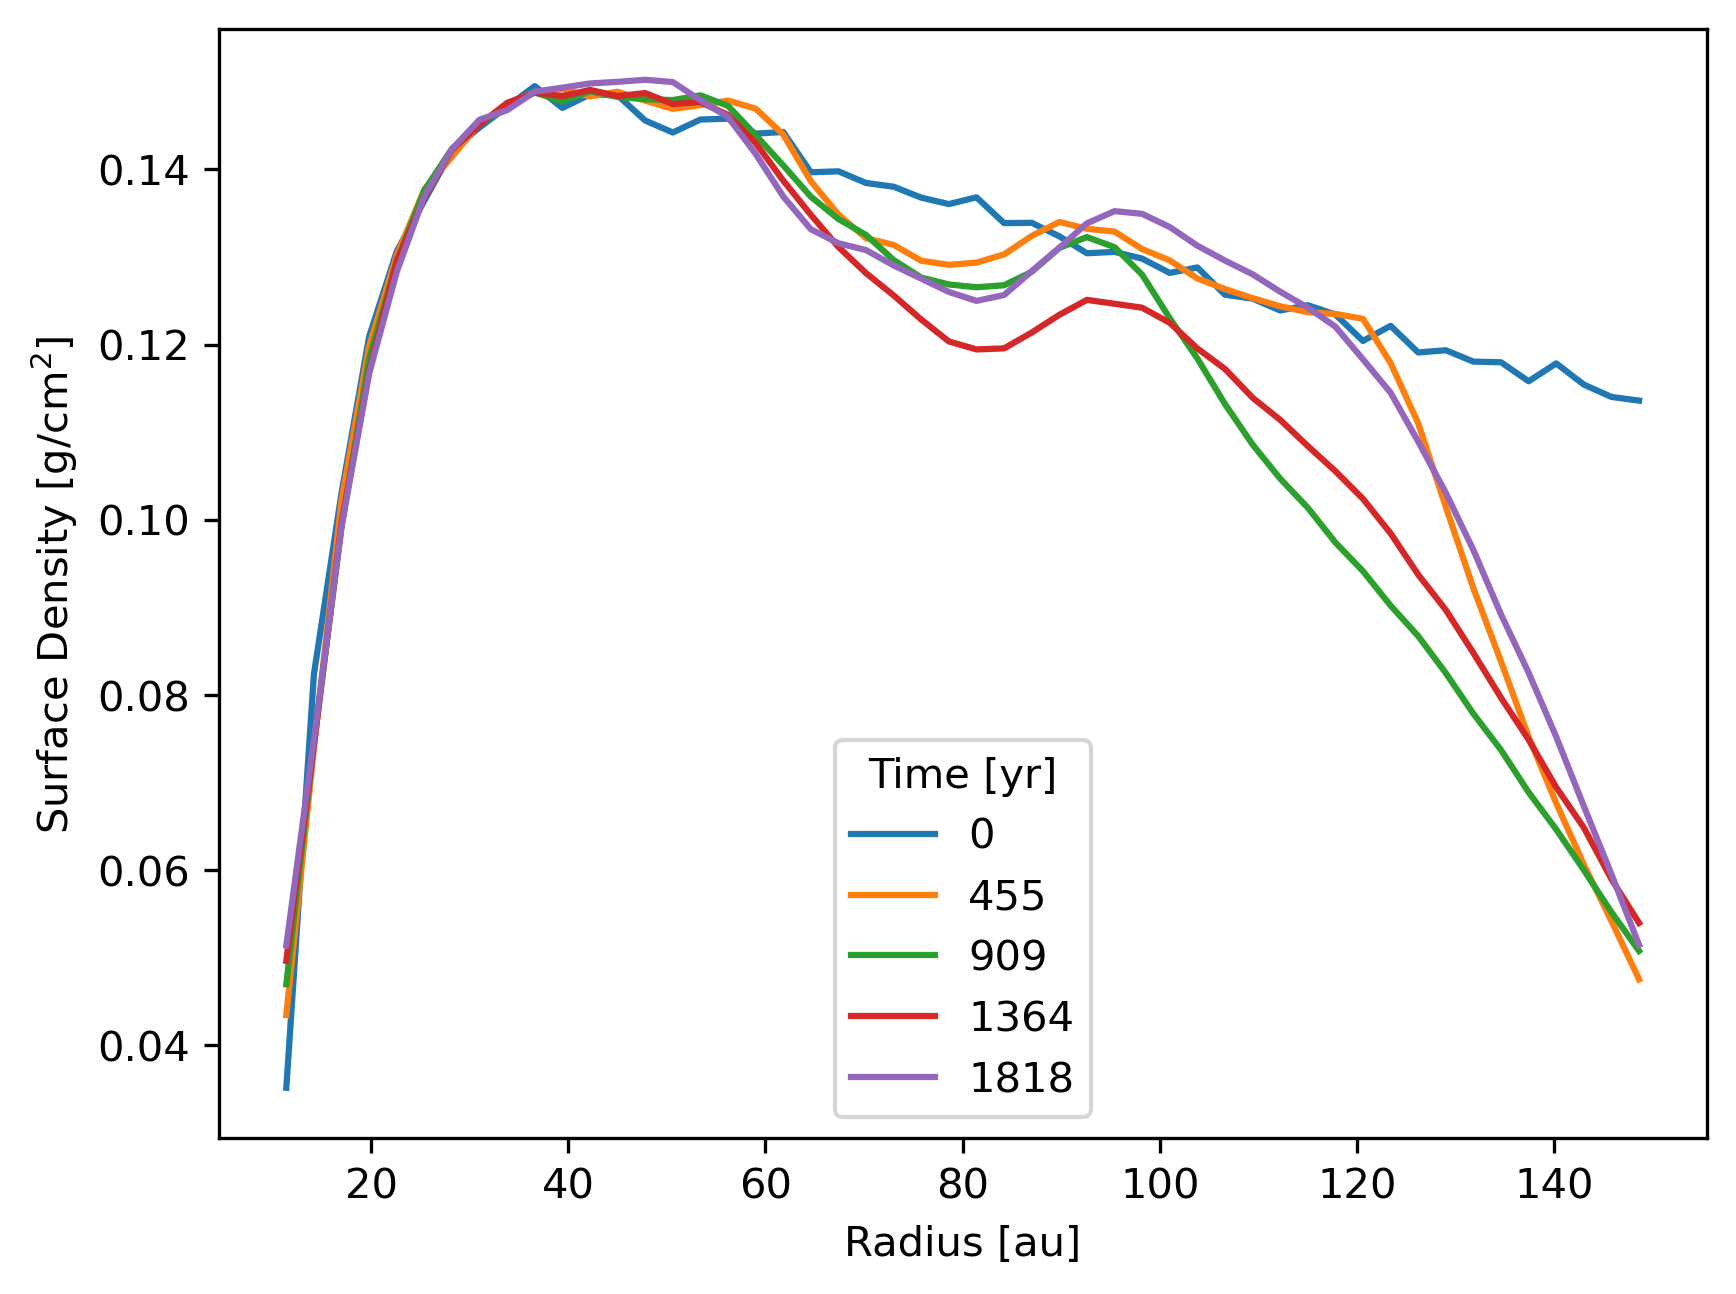
Density profiles
Plot a density profile for multiple snapshots.
Note
The data is from the example dataset of a Phantom simulation with a single dust species using the separate particles (or “2-fluid”) method with an embedded planet.
import matplotlib.pyplot as plt
import numpy as np
import plonk

# Load simulation
sim = plonk.load_simulation(prefix='disc')

# Generate density profiles for every 7th snap
stride = 7
times = sim.properties['time'].to('year')[::stride]
profiles = list()
for snap in sim.snaps[::stride]:
    profile = plonk.load_profile(snap, cmin='10 au', cmax='150 au', n_bins=50)
    profiles.append(profile)

# Plot profiles
fig, ax = plt.subplots()
units = {'position': 'au', 'surface_density': 'g/cm^2'}
for time, profile in zip(times, profiles):
    label = f'{time.m:.0f}'
    profile.plot(
        'radius', 'surface_density', units=units, label=label, ax=ax
    )
ax.set_ylabel('Surface Density [g/cm${}^2$]')
ax.legend(title='Time [yr]', loc='best')