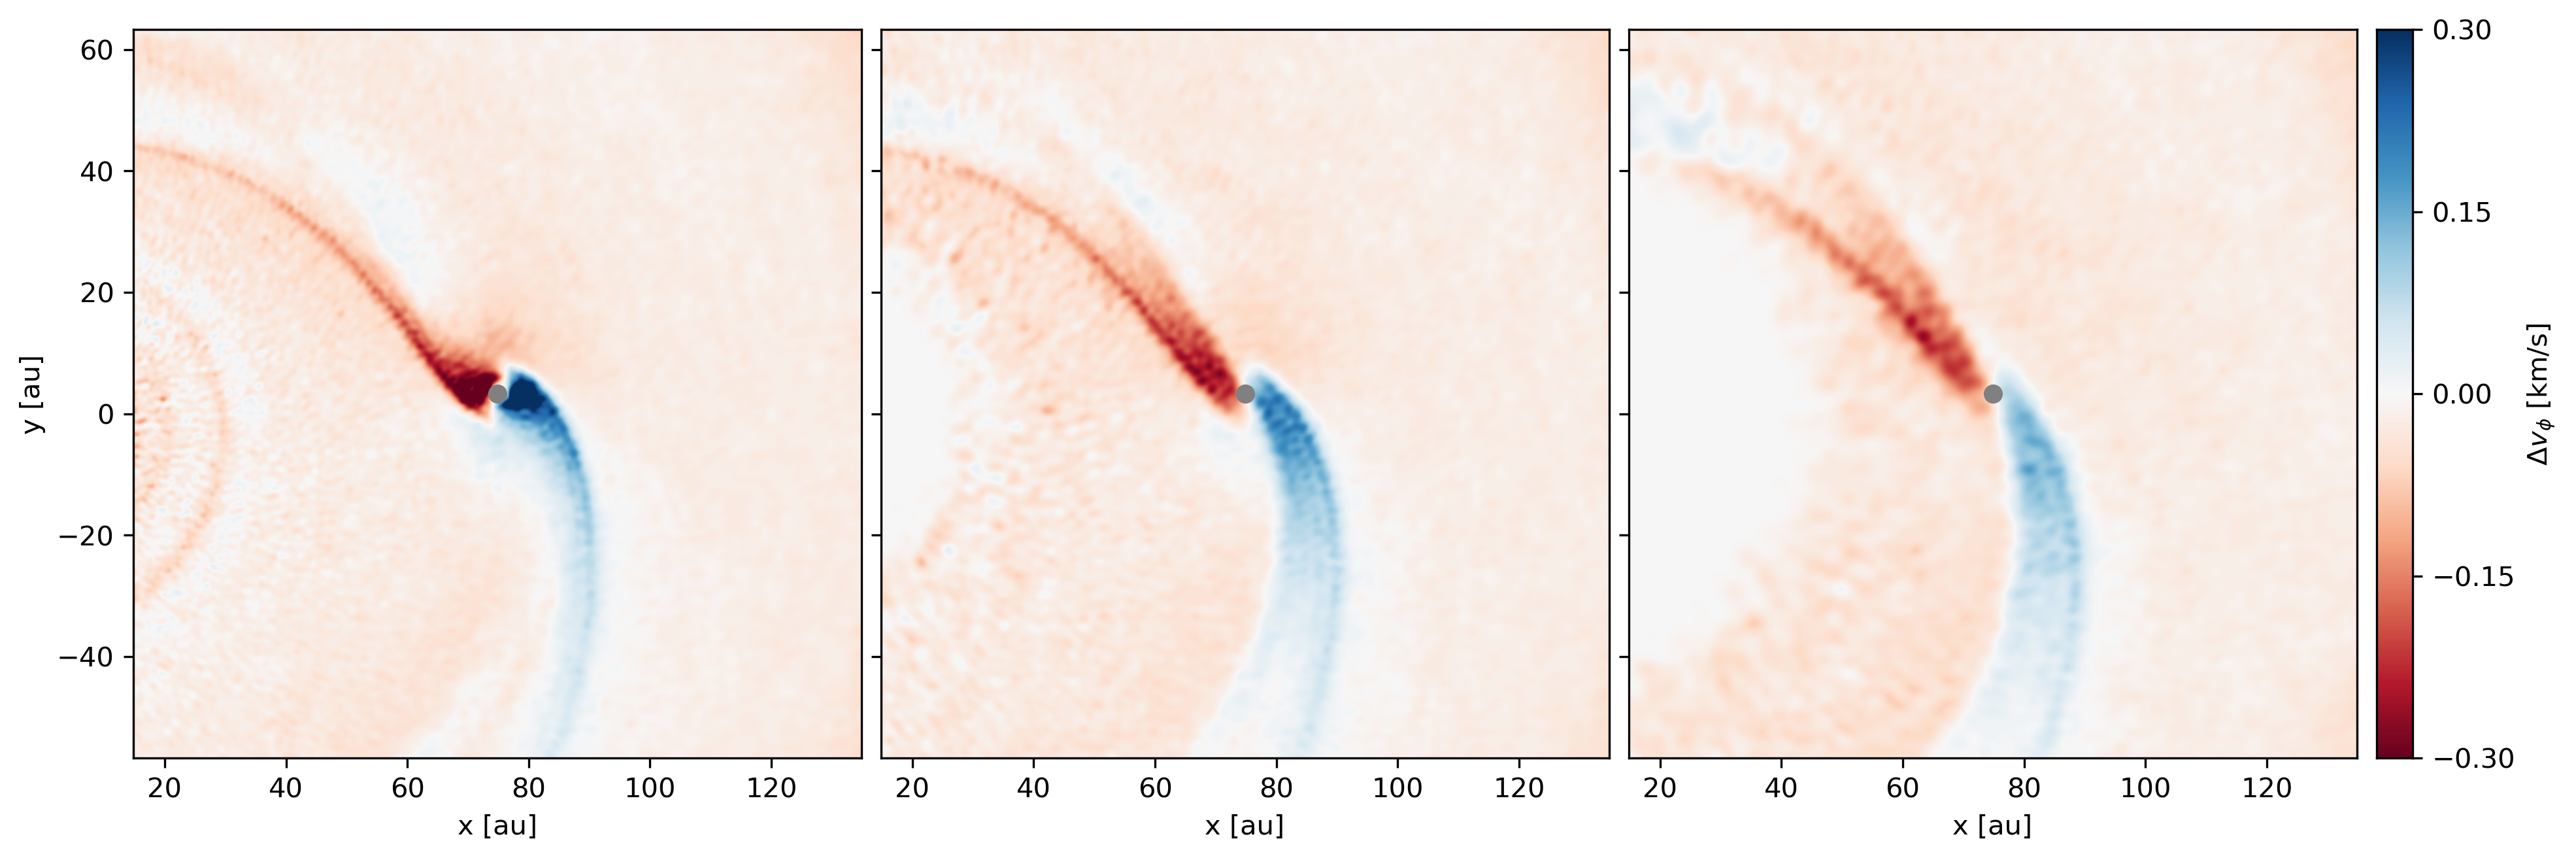
Deviation from Keplerian
Plot deviation from Keplerian velocity around planet.
Note
The data is from the example dataset of a Phantom simulation with a single dust species using the separate particles (or “2-fluid”) method with an embedded planet.
import matplotlib.pyplot as plt
import numpy as np
import plonk
from mpl_toolkits.axes_grid1 import AxesGrid

au = plonk.units('au')
km_s = plonk.units('km/s')

# Index of sink particles
star_index = 0
planet_index = 1

# Altitudes for slices
z_slices = (0.0, 5.0, 10.0) * au

# Maximum velocity (km/s)
velocity_max = 0.3 * km_s

# Width for plot
window_width = 120 * au

# Load data
snap = plonk.load_snap('disc_00030.h5')

# Set default units
snap.set_units(position='au', velocity='km/s')

# Star and planet
star = snap.sinks[star_index]
planet = snap.sinks[planet_index]

# Set window around planet for plot
extent = (
    planet['x'] - window_width / 2,
    planet['x'] + window_width / 2,
    planet['y'] - window_width / 2,
    planet['y'] + window_width / 2,
)


@snap.add_array()
def delta_keplerian(snap):
    """Deviation from Keplerian velocity."""
    G = plonk.units.gravitational_constant
    M_star = star['mass']
    v_k = np.sqrt(G * M_star / snap['R'] ** 3)
    return ((snap['v_phi'] - v_k) * snap['R']).to_base_units()


# Set units for plot
snap.set_units(position='au', delta_keplerian='km/s')

# Generate figure and grid
fig = plt.figure(figsize=(15, 5))
grid = AxesGrid(
    fig,
    111,
    nrows_ncols=(1, 3),
    axes_pad=0.1,
    cbar_mode='single',
    cbar_location='right',
    cbar_pad=0.1,
)

# Focus on deviation from Keplerian of gas
gas = snap['gas']

# Loop over z-slices
for slice_offset, ax in zip(z_slices, grid):
    gas.image(
        quantity='delta_keplerian',
        extent=extent,
        interp='slice',
        slice_offset=slice_offset,
        vmin=-velocity_max,
        vmax=velocity_max,
        cmap='RdBu',
        show_colorbar=False,
        ax=ax,
    )
    # Plot planet marker
    ax.plot(planet['x'].to('au').m, planet['y'].to('au').m, 'o', color='gray')

# Add colorbar
cbar = grid.cbar_axes[0].colorbar(ax.images[0])
cbar.set_label_text(r'$\Delta v_{\phi}$ [km/s]')