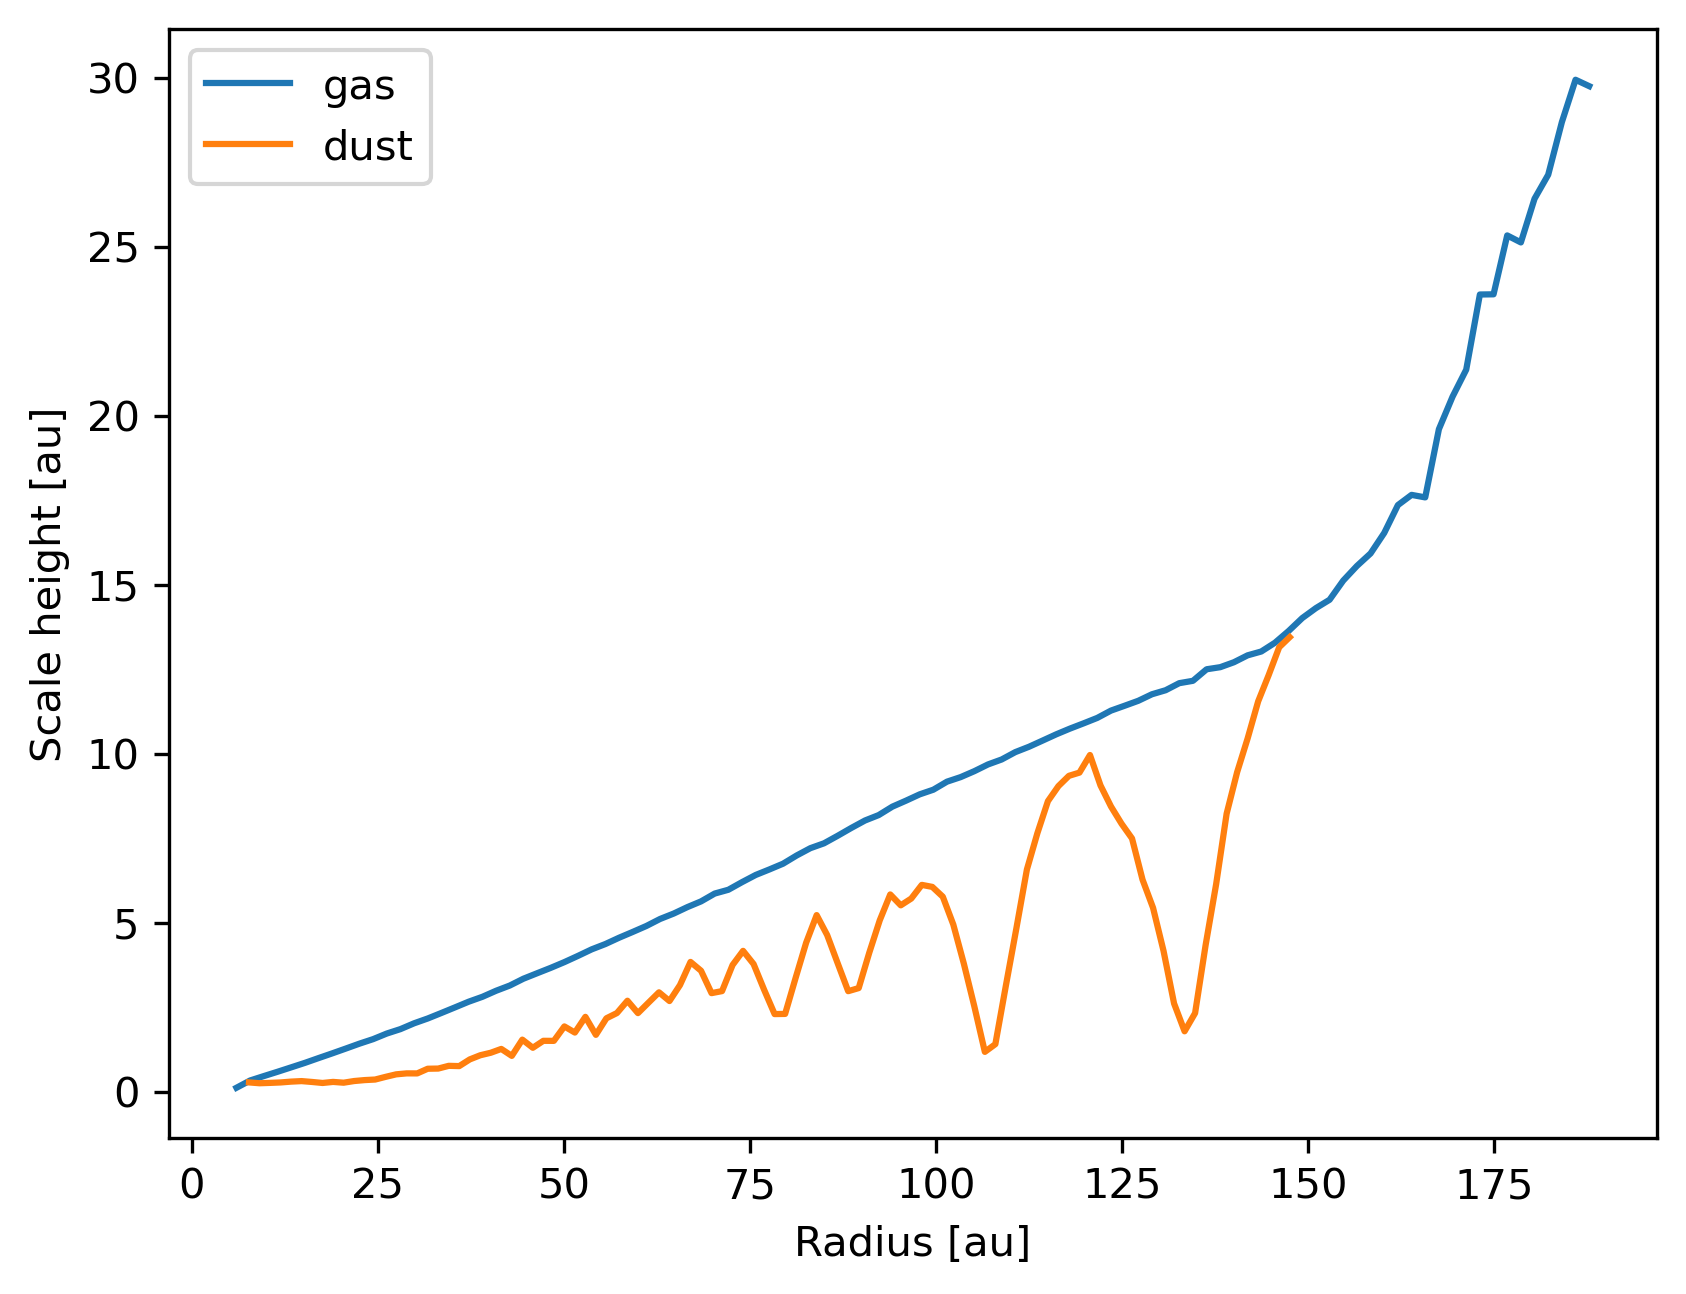
Scale height of dust and gas
Plot the dust and gas scale heights.
Note
The data is from the example dataset of a Phantom simulation with a single dust species using the separate particles (or “2-fluid”) method with an embedded planet.
import matplotlib.pyplot as plt
import plonk

snap = plonk.load_snap('disc_00030.h5')

subsnaps = snap.subsnaps_as_dict(squeeze=True)

profs = {family: plonk.load_profile(subsnap) for family, subsnap in subsnaps.items()}

fig, ax = plt.subplots()

for label, prof in profs.items():
    prof.set_units(position='au', scale_height='au')
    prof.plot('radius', 'scale_height', label=label, ax=ax)

ax.set_ylabel('Scale height [au]')