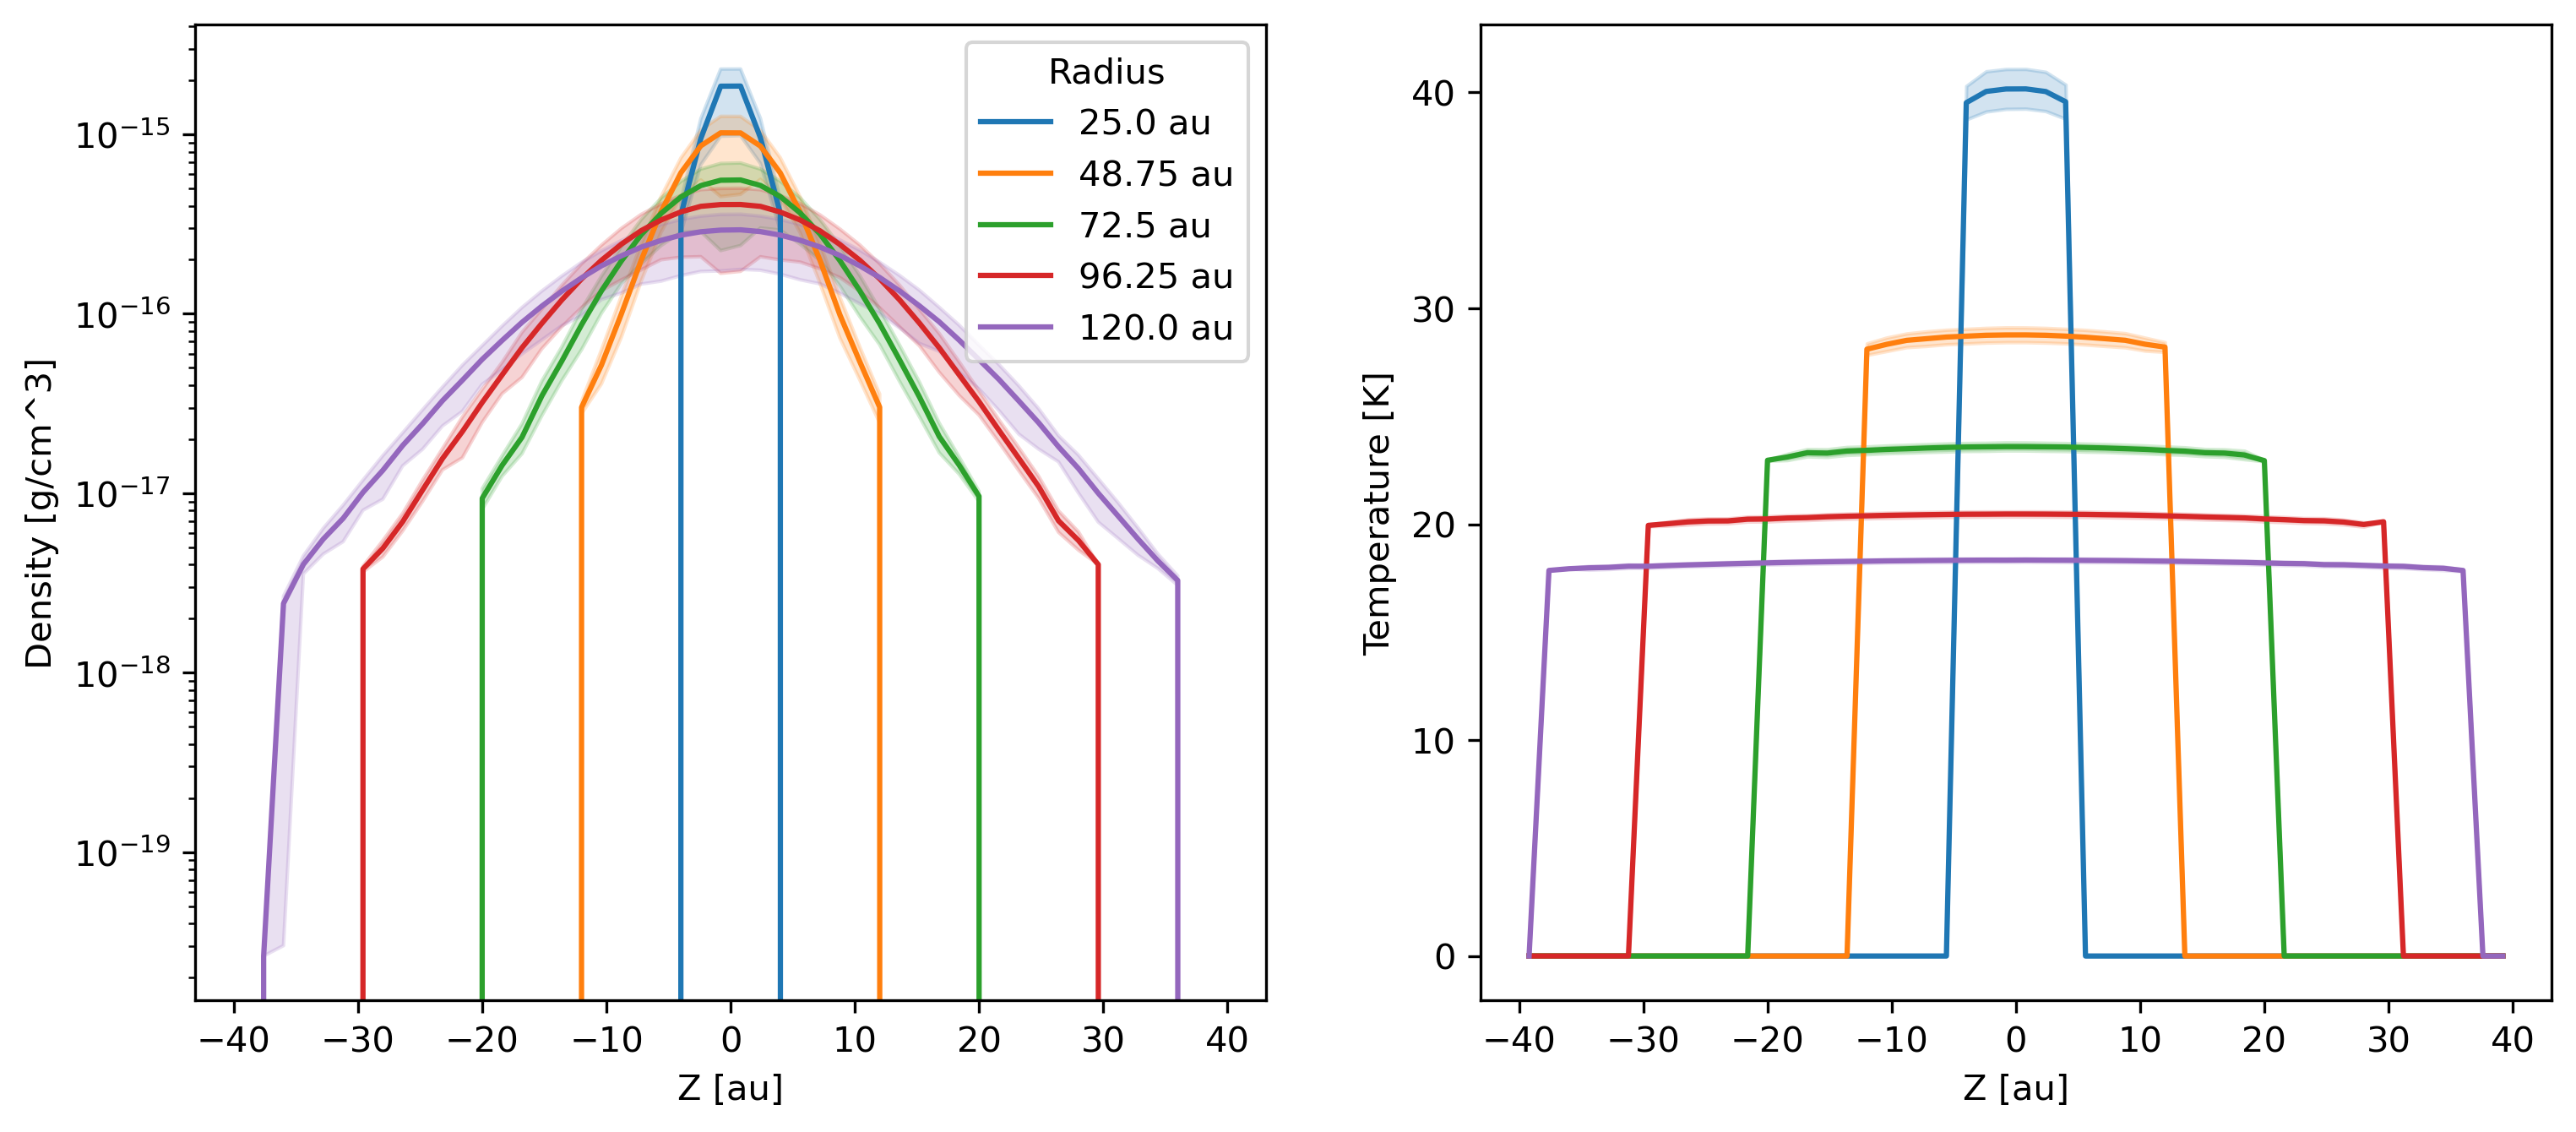
Vertical profile in a disc
Calculate and plot the density and temperature vertical profiles at multiple radii in a disc.
Note
The data is from the example dataset of a Phantom simulation with a single dust species using the separate particles (or “2-fluid”) method with an embedded planet.
import matplotlib.pyplot as plt
import numpy as np
import plonk
from plonk import analysis

au = plonk.units('au')

# Load snapshot
snap = plonk.load_snap('disc_00030.h5')

# Set molecular weight for temperature
snap.set_molecular_weight(2.381)

# Choose radii at which to calculate z-profiles and thickness
radius = np.linspace(25, 120, 5) * au
dR = 2.0 * au

# Vertical height
vertical_height = 40 * au

# Plot units
snap.set_units(position='au', density='g/cm^3', temperature='K')

# Make figure and axes
fig, axs = plt.subplots(ncols=2, figsize=(12, 5))

# Loop over radius
for R in radius:

    # Generate an annulus SubSnap
    subsnap = analysis.filters.annulus(
        snap=snap,
        radius_min=R - dR,
        radius_max=R + dR,
        height=1000 * au,
    )

    # Create vertical profile
    prof = plonk.load_profile(
        subsnap,
        ndim=1,
        coordinate='z',
        cmin=-vertical_height,
        cmax=vertical_height,
        n_bins=50,
    )

    # Plot density
    ax_kwargs = {
        'xlabel': 'Altitude [au]',
        'ylabel': r'Density [g/cm${}^3$]',
        'yscale': 'log'
    }
    prof.plot(
        x='z',
        y='density',
        std='shading',
        label=f'{R:~P}',
        ax_kwargs=ax_kwargs,
        ax=axs[0],
    )

    # Plot temperature
    ax_kwargs = {
        'xlabel': 'Altitude [au]',
        'ylabel': 'Temperature [K]',
        'yscale': 'linear'
    }
    prof.plot(
        x='z',
        y='temperature',
        std='shading',
        label=f'{R:~P}',
        ax_kwargs=ax_kwargs,
        ax=axs[1],
    )

axs[0].legend(title='Radius', loc='upper right')
axs[1].legend().remove()